last day (19 days later) » 

09:49
0
Q: Adding several y axes in D3js

Nicklas WingerI'm working on a horizontal line chart in d3js that displays several lines based on json input. It has zooming and panning, but also need to display a y-axis for each of the drawn lines. In my case, three. First off, is this bad practice? Should I stack all three on one side, or should I keep t...
Do you need three axes or could you show all lines with the same axis? The tutorial you've linked to explains it quite nicely -- maybe you would find it easier to start with a smaller example?
Hi (again :)) Lars. Yes, I do need all axes.My problem in regards to the tutorial is that my data is in another format. As you might remember (or read out of this for that matter) is that I get my data with json, which sort of complicates it in my head. I've updated my above code with a though I had on setting the domains.
Well it looks like you're not drawing the second axis at all -- is that what you're struggling with?
Oh, sorry. Forgot to update image. The axis is drawn, but with the same values I guess. (Just using the two axes for now - can add a third later when this is sorted out)
It looks like the axis is drawn correctly. How would you like it to be different?
09:49
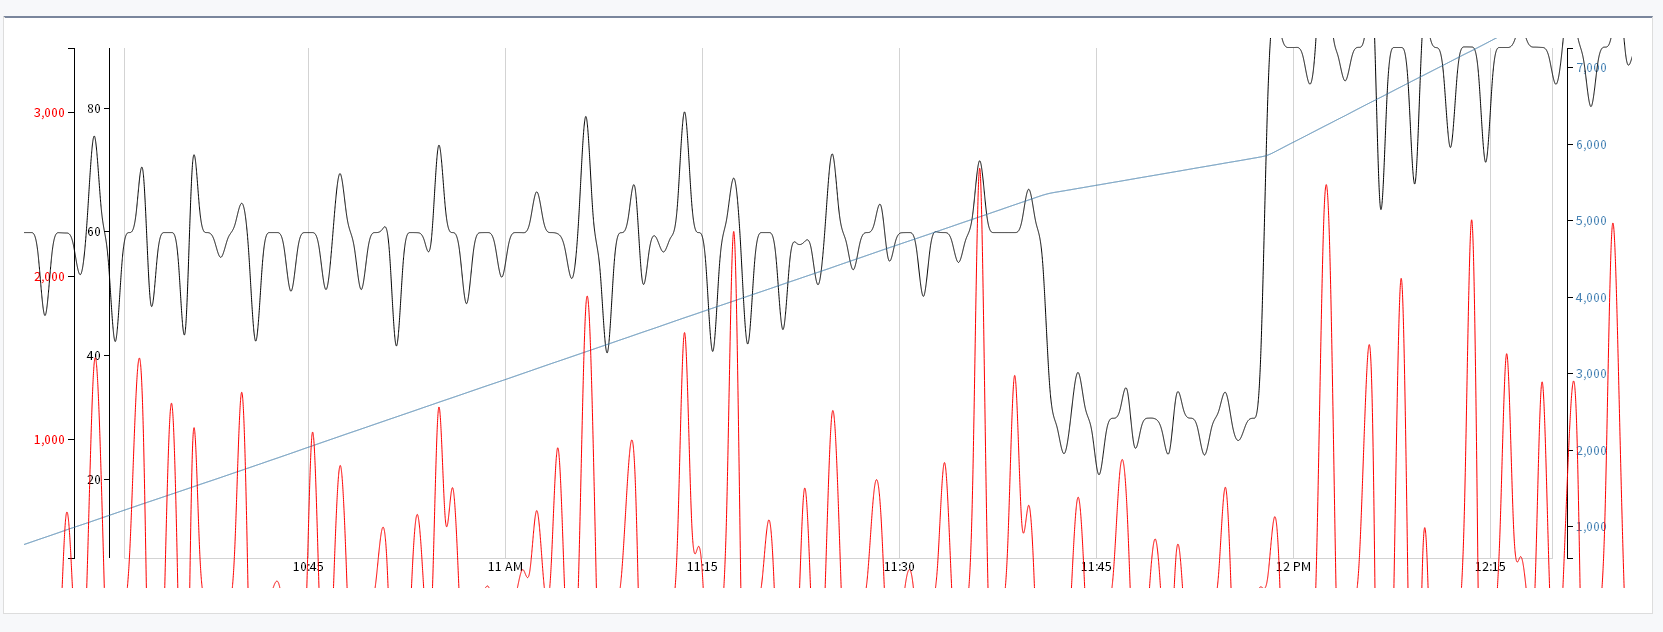
Take a look at the updated question. Attached an image of the old component, which does not handle large amounts of data very well. (Hence trying to recreate a new one in D3js with complete control of the component ourselves). Basically, this is what I'm trying to achieve.
So it's only a question of styling? It looks like you can achieve what's in the picture by adding a bit of space between the axes and using the default styling (tick lengths etc).
Might be 'only' that. However, also a question of being able to connect the zooming and panning to all three y-axes. As of right now, only the first y0 axis is reacting to zoom and pan.
You need to update the domains of the other axes in your zoomed handler function. The domain of the first axis gives you the "points" you need to update to.
Ok. Thanks for your help @LarsKotthoff! :) I'll post the answer once sorted out.
@LarsKotthoff Ended up taking another approach, which seems a bit more clean (codewise) to me. Still not able to zoom though, and now all I do is zoom a grid behind the actual lines. Also, my timestamp is off again. Could you possibly provide some tips? See this fiddle: jsfiddle.net/nwinger/k2j6a
Well, you're not parsing the timestamps, so you don't have Date objects for your x axis. You're also not binding any data to the lines, so this way of updating them won't work. Have a look at jsfiddle.net/k2j6a/1 -- I've updated one of the lines to work there. The other lines need to be updated in a similar manner, after setting the domain of the respective scales.
09:49
Hi. Is it ok if I have this chat open for a while? :)
Sure, no problem.
Thank you. Just have to say that you've been of tremendous help; really appreciate your time.
No problem at all.
Looking at your jsfiddle, there're quite a number of things to fix though.
It might be easier to start with a simple example and get it working for that.
I recon. I'm all new to d3 and I'm working on a component that's supposed to be done this week. Too little time and people.
The key thing is that you take the new domain of the scale linked to the zoom and use that to infer what the domain for the other scales should be.
Apart from that it's basically the same as in the single y axis case.
10:04
Yeah, I'm not sure I'm getting that zoom. Right now, this is where I'm at.
function zoomed() {
graph.select(".x.axis").call(xAxis);
graph.select(".y.axisLeft").call(yAxisLeft);
graph.select(".y.axisLeftLeft").call(yAxisLeftLeft);
graph.select(".y.axisRight").call(yAxisRight);
graph.select(".x.grid")
.call(make_x_axis()
.tickFormat(""));
graph.select(".y.axis")
.call(make_y_axis()
.tickSize(5, 0, 0));
graph.selectAll(".y1")
.attr("d", line1(speed));
graph.selectAll(".y2")
.attr("d", line2(depth));
graph.selectAll(".y3")
.attr("d", line3(weight));
};

var make_x_axis = function () {
Giving me zoom on all three, but only pan on y1
Which, I guess, is because of the make_y_axis call to scale(y1)
10:18
Yes, you need to set the domain of the other scales, e.g. y2.domain(...).
Hm. Added another zoom behavior called zoomRight, and did the following from function zoomed:
function zoomed() {
zoomRight.scale(zoom.scale()).translate(zoom.translate());
...
}
Appears to be working
So you have two zoom behaviours now?
Three, actually.
One for each y axis
Followed the last part of the answer in this post: stackoverflow.com/questions/22544200/…
Which, by the sound of your question was propably not correct? :)
No, that could work actually.
You just have to be very careful with what you do in the handler functions.
Seems to be panning and zooming fine on all three lines and axes.
10:28
Hmm, I hadn't actually thought of that, but that's quite an elegant solution.
I'm not 100% if that won't cause problems later, but if it's working for you...
Hehe. Mind if ask how you would've implemented it (pseudo code if you'd like)
And, also, I got my x axis to display the dates correctly, but then all of my lines disappeared :S
I would have used one handler and determined the domains of the other scales from the domain of the scale attached to the zoom.
Are you parsing the dates just for the scales?
                            x = d3.time.scale().domain(d3.extent(timestamp, function (d) {
                                return d;
                            })).range([0, w]);
10:37
Ok, so where are you parsing the dates?
Ah, I'm fetching data with json here, which is different from the fiddle:

var url = '@Url.Action("DataBlob", "Trend", new {id = Model.Unit.UnitId, runId = Request.Params["runId"]})';
var data = $.getJSON(url, null, function(data) {
var list = JSON.parse(data);
var format = d3.time.format("%Y-%m-%dT%H:%M:%S").parse;
list.forEach(function(d) {
speed.push(d.Speed);
depth.push(d.Depth);
weight.push(d.Weight);
var date = format(d.Time);
d.Time = date;
timestamp.push(d.Time);
});
Ok, that looks fine.
And how are the lines defined?
x = d3.time.scale().domain(d3.extent(timestamp, function (d) {
return d;
})).range([0, w]);

y1 = d3.scale.linear().domain([0, d3.max(speed)]).range([h, 0]);
y2 = d3.scale.linear().domain([0, d3.max(depth)]).range([h, 0]);
y3 = d3.scale.linear().domain([0, d3.max(weight)]).range([h, 0]);

line1 = d3.svg.line()
.interpolate("basis")
.x(function (d, i) {
return x(i);
})
.y(function (d) {
return y1(d);
});

line2 = d3.svg.line()
.interpolate("basis")
.x(function (d, i) {
return x(i);
})
.y(function (d) {
It needs to be x(d.Time) in your line definitions.
                            line1 = d3.svg.line()
                                .interpolate("basis")
                                .x(function (d, i) {
                                    return x(d.Time);
                                })
                                .y(function (d) {
                                    return y1(d);
                                });
?
10:51
Yes.
Auch. That returns a whole bunch of parsing errors in my console.
Debugging in console and looking at d, it's just a numerical value (i.e. 59) and not a date
Ok, what's the data you're passing to the line generators?
11:07
THe arrays in the fiddle are the ones I use. Only difference is that I call it with json here and get more data.
And, when doing console.log(timestamp) now, I get this:
[Wed Apr 09 2014 10:01:23 GMT+0200 (W. Europe Daylight Time), Wed Apr 09 2014 10:01:56 GMT+0200 (W. Europe Daylight Time), Wed Apr 09 2014 10:02:28 GMT+0200 (W. Europe Daylight Time)...]
That's after formatting it
Oh right, your data are disconnected. In that case, try x(timestamp[i]).
11:22
Yeah. Since all three (depth, weight, speed) have the same timestamp, I felt it was easier to separate the three into arrays.
And, that works. Fantastic :)
Great :)
Would you mind adding your solution with the multiple zoom behaviours as an answer for reference?
Another quick question I have in regards to the zooming and panning, or really the lines in general. I've set some margins on my grid outside its width and height. How come my lines are drawn all the way out to the edges? :)
Of course :)
12:01
Well the line generators are defined outside the graph area as well.
The easiest way to fix that is probably to apply a clip path.
How do I do that? :$
This comes up quite frequently, e.g. in this question: stackoverflow.com/questions/10486896/…
Ok. I'll have a look at it :) Thanks a million, again! Added an answer to the original post, that will be accepted in 18 hrs :)

  last day (19 days later) »