0
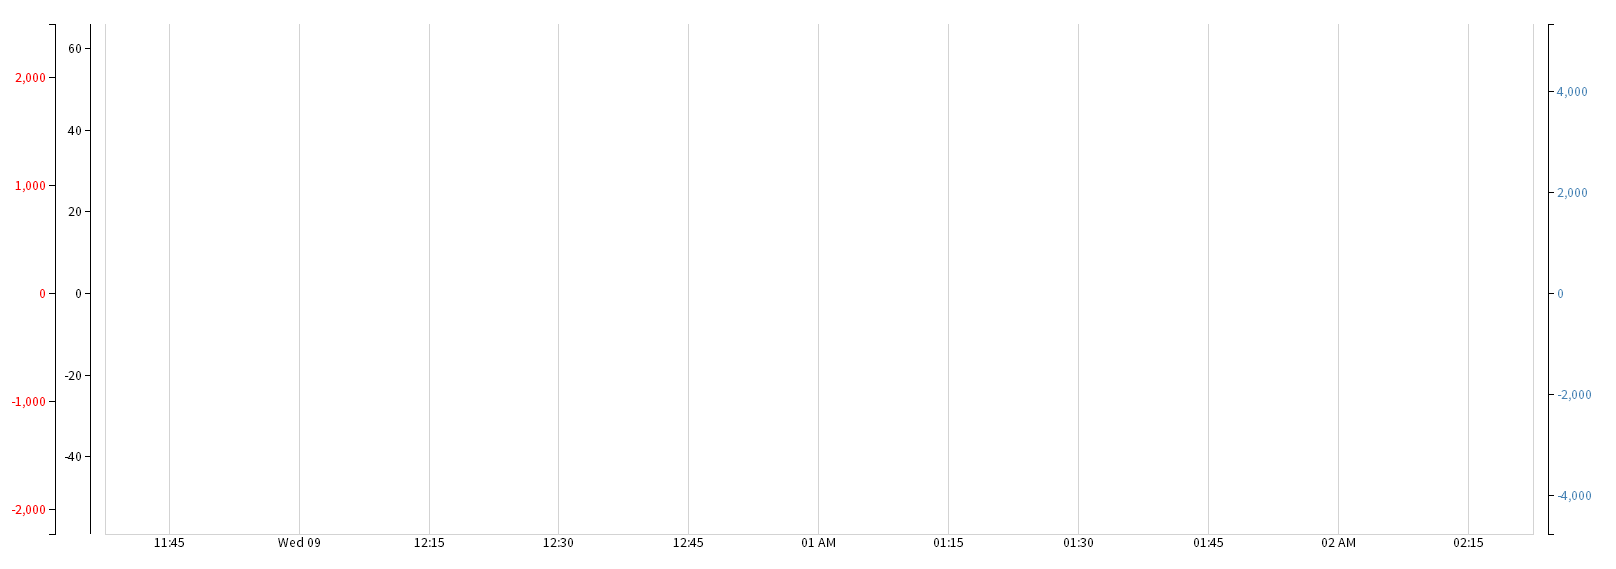
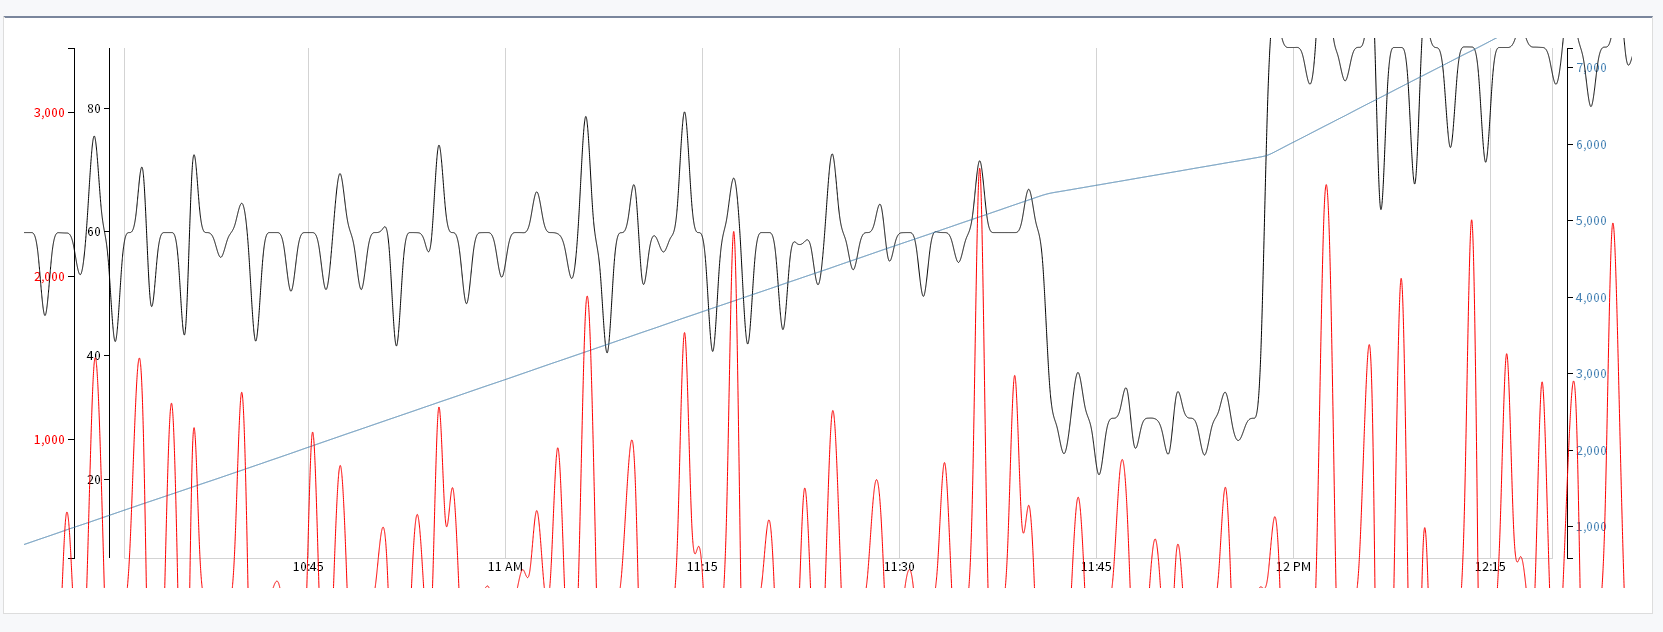
![]() I'm working on a horizontal line chart in d3js that displays several lines based on json input. It has zooming and panning, but also need to display a y-axis for each of the drawn lines. In my case, three.
First off, is this bad practice? Should I stack all three on one side, or should I keep t...
I'm working on a horizontal line chart in d3js that displays several lines based on json input. It has zooming and panning, but also need to display a y-axis for each of the drawn lines. In my case, three.
First off, is this bad practice? Should I stack all three on one side, or should I keep t...


