« first day (63 days earlier)      last day (3389 days later) » 
07:00 - 18:0020:00 - 23:00

20:30
0
Q: Matlab fmincon inital guess trouble

user3897744I am trying to calculate the minimum of a function with multiple variables, the only constraints I have are the upper and lower bounds of the variables. The problem I am having is that fmincon does not change the input value from the initial guess value I give it. This is the output I get: init...

This user has trouble trying to minimize a cost function - says that the minimum is the same no matter what initial guess he/she has.
I said there's probably something wrong with the cost function... I need to see some code. OP won't share the code lol.
So I know for sure something's wrong, but the OP won't allow me to figure out what it is... so why bother asking the question?
The code written is standard boiler-plate code for trying to minimize a cost function through fmincon, but the actual cost function to minimize is in a function called cmpBC, whose source is not displayed.
@rayryeng this just changed:)
finally lol
good job achieving that;)
hahaa thanks Doctor :P
guys
*Hi guys
I've done a training and this is what I got
20:43
Cháo Chú!
right
haha
Chào*
Hi @rayryeng
Chao Ray
haha
no image sir.
www. dropbox. com/s/1xm78xxyh3olo65/Regression.jpg
stack doesn't allow showing images from dropbox =.+
although R value is high but I feel something is wrong with this training
is it because of the data?
Yeah don't rely on the R value here.
thanks @rayryeng
It will sometimes give you false hope.
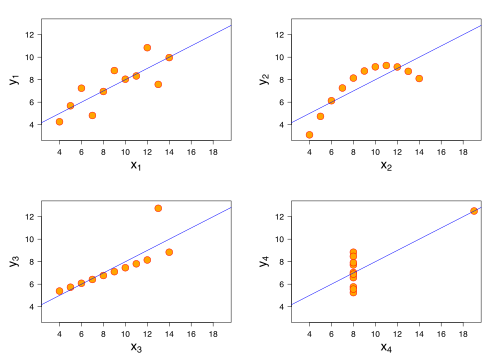
Have you ever heard of the Anscombe Quartet?
why?
not yet Ray
20:46
Each of those datasets has an R value of 0.816
but look at the variability in the distribution of the data.
Basically, your data falls into the bottom right category
there are extreme outliers that push the R value to something high
does that mean there is no way to fix it except changing the data?
You need to detect outliers and filter those out, then try to fit your model again.
No not necessarily. You just figure out how to filter out outliers.
I got that
and googling how to identify outlier
haha
One way is to assume that your distribution of data is Gaussian, then build a multimodal Gaussian model for it.
find the mean and std.dev of each feature for a select few samples of your data.
then determine the probability that the target point belongs in the bulk of the distribution.
anything that doesn't surpass this probability could be considered an anomaly.
Also, if I can suggest something, I would put some RANSAC into your training process.
What you would do is train your model several times.
each time, you sample a selection of your data from the training set... basically... just enough data so that you can successfully build your model.
Then you measure the error / cost between the training and ground truth, then choose the parameters that gave you the lowest cost.
this sampling is random BTW... hence RANSAC - RANdom SAmple Concensus.
I would try with RANSAC
20:52
Totally.
Let me see if I can find something that I wrote up about it...
yeah
0
Q: Determining regression coefficients for data - MATLAB

kautilyaI am doing a project involving scientific computing. The following are three variables and their values I got after some experiments. There is also an equation with three unknowns, a, b and c: x=(a+0.98)/y+(b+0.7)/z+c How do I get values of a,b,c using the above? Is this possible in MATL...

thank you @ray :)
just a question for Anscombe Quartet
sure,
what's wrong with the top right?
20:54
all of those values share exactly the same sample statistics.
sorry
oh there's nothing wrong with it at all.
top left
the top-left is what we expect
however, all of the datasets you see in the quartet share exactly the same sample statistics.
same sample mean, same sample std. dev., etc.
ah
20:55
You calculate the R-value by sample statistics... so using the mean and standard deviation or perhaps higher order moments.
got that
so if your data all shares the same sample statistics, even though they vary greatly in a spatial sense, the R-value will be the same.
Even though the R-value is what is reported in practice to give you a sense of how good your model fit is, never rely on it completely.
is there any formula for R-value?
Yup... it's the correlation coefficient
ah
20:58
Simply put, it's the covariance between the ground truth data Y with the predicted data X
R-value is this r
divided by the variance of X and Y respectively.
correct.
R is the correlation coefficient.
higher values of R denote that you have a model that best describes the input data.... theoretically.
I know correlation coef but didn't know R-value is the same
as you can see, r relies on sample statistics, and if you have data that has the same sample statistics and ignoring the spatial properties, then it's going to give you the same value.
Yes. R value and correlation coefficient are the same... it depends on who you talk to.
People in data analysis say R value.
People in statistics say correlation coefficient. Tomayto, Tomahto.
haha
thank you @ray
I will give a try with RANSAC
:)
21:01
sounds good!
You're very welcome.
@rayryeng Just wanted to update you on the Octave saga...
how's it going?
got 3.8.2 installed
with the experimental GUI?
yep, with the gui
went to install the image processing package and it requires...
Octave 4.0
21:03
yeah that's why I wanted to know if you got Octave 4.0 installed.
because I'm basically stuck lol
I want to get the image package installed, but it needs 4.0, and I can't install 4.0 unless I do it through the source
This is a serious oversight on their part...
but this is from macports... the only image package they've got listed is the latest
they should leave multiple packages available to accommodate for each version.
well, technically there are, from forge
how do you force Octave to install a package that pertains to your version of Octave?
unless you manually download the tarball for that version
but that's annoying... there's gotta be a -forge option to download legacy packages.
aye, there's the rub
and i'm kinda guessing at which tarball is the right one
21:09
gotcha.
there is no right one :)
blah
21:40
Congratulations on your new title, @AndrasDeak!!
22:03
@rayryeng A bit of progress...
Package Name  | Version | Installation directory
--------------+---------+-----------------------
     control *|   2.8.3 | /opt/local/share/octave/packages/control-2.8.3
     general *|   1.3.4 | /opt/local/share/octave/packages/general-1.3.4
       image *|   2.2.2 | /Users/bryan/octave/image-2.2.2
      signal *|   1.3.2 | /opt/local/share/octave/packages/signal-1.3.2
     specfun  |   1.1.0 | /opt/local/share/octave/packages/specfun-1.1.0
I installed general using macports
then installed the image package from the tarball
signal also has to be there, but i think it got installed in one of my previous attempts
but I still can't get FLTK working, so I'm back to gnuplot
and there's an annoying warning:
>> img=imread('lena.jpg');
warning: your version of GraphicsMagick limits images to 8 bits per pixel
22:19
and imshow plots images upside-down :)
07:00 - 18:0020:00 - 23:00

« first day (63 days earlier)      last day (3389 days later) »