« first day (1799 days earlier)      last day (1413 days later) » 

9:11 AM
0
Q: find all the indices of all the duplicate elements in Array

impopularGuy Given an Integer array, find all the indices of all the duplicate elements in it. For example, consider A = [4, 12, 9, 8, 9, 12, 7, 1]. Since 12 and 9 have duplicates, all their indices will be returned i.e. d = [2, 3, 5, 6]. The length of A is below 200 and the integer elements are...

This looks to be easily solved with the 2nd and 3rd outputs of unique(). What on Earth is this dude doing with hist? (and not even histogram)
 
Dunno, I am trying to crack it and I have no idea how to do it with those indices
histogram is the naive way (histcounts in particular)
 
The upvote also puzzles me
@AnderBiguri hm? How do you mean? Make integer-wide bins in this case and find all instances >1?
 
hes finding the value of repeats, then searching their indices, he is literally doing his description of the problem.
@Adriaan yes
 
Ah, so he can just call histcounts() once, then use a logical >2 and be done with it.
 
U = unique(A);
[co,ce] = hist(A,U);
an = ce(co>1);
does that
I would have done it as counts=histcounts(A,max(A)) maybe
 
9:21 AM
Calling hist() that often, and growing d will slow you down indeed.
Right, I'd never have thought of histcounts and just used unique, diff and be done with it.
 
yup indeed. I also though of the outputs of unique, but I am a bit dense this morning
 
9:44 AM
I'll join your club
 
of dense-morningers?
 
yeah
 
9:56 AM
Hehe, I had way-off results yesterday, and couldn't for the life of me figure out why. Turned out I had specified 6 header lines, whereas I needed just 4. Ergo: the lowest-degree fields (and with highest amplitude) were comitted from the results ...
Just putting my appreciation of the new tiledlayout function here. It's easy to use and gets nice and clean results, especially with those general x and y labels, and having the columns part slightly to allow for the colour bar, as opposed to having a single subplot smaller than the rest.
Me gusta mucho
 
yeah, looks nice
 
The only thing I'd like, but haven't put much thought into yet, is whether it'd be able to put a general horizontal colour bar on the top or bottom, i.e. 2 subplots wide. Most papers that do these kind of global maps on the same scale do it like that.
Although a single, smaller bar in the middle looks OK to me as well
 
you can change the size of the colorbar programatically I think
 
10:12 AM
I could start to look into plotting it as a better "world map", i.e. with a more decent projection than simple cylindrical, but then I might as well use CartoPy again.
 
10:50 AM
57
Q: Can we have Hot Meta Posts re-enabled now that SE has admitted that Meta actually represents the engaged user base?

EJoshuaS - Reinstate MonicaFollow-up to: We’re removing “Hot Meta Posts” from Stack Overflow's sidebar for now; moderators now control the [featured] tag A recent blog post from Stack Exchange admitted that Meta actually does represent engaged users to a much greater extent than they previously believed. That being the ca...

Interesting that this got attached.
I'd like to see it implemented, I'm slightly fed up with only seeing Samuel featuring his own posts. They're important, that's not the point, but seeing about nothing else than Triage and Dupes for the past months makes the entire featured thing a bit obsolete
 
11:06 AM
heh, no way
 
12:02 PM
@CrisLuengo I'm gonna slap some neural networks on top and call it "relativistic AI", will you accept my paper?
 
12:48 PM
@AndrasDeak Today I still followed up with your suggestion of doctests, and just started reading the docs. Even they use
if __name__ == "__main__":
    import doctest
    doctest.testmod()
D:
 
Which "docs"? You can do doctests with multiple libraries I think. Pytest has --doctest-modules.
In that case you run doctests just like a regular test suite. No meddling with executable blocks.
 
ah quite a bit further they also suggest python -m doctest -v example.py which already looks better, but still the relative imports are probably gonna fail
@AndrasDeak (these)
 
1:06 PM
I figured (from the import)
I think you should just use pytest...
 
1:18 PM
but I guess the import problem is independent of the testing framework, isn't it?
as soon as you want to run a file from a submodule that has some relative imports you're in trouble I think
unless you do some sys-butchering
 
1:30 PM
@flawr yup
but if you're not executing each module for doctests that's already one less issue
 
@flawr of course! As long as the paper shows at least a 0.001% improvement over whatever you pick as “state of the art”.
 
How do I go to implicit expansion again if I have bsxfun(@times A,B), where A is 10x1 and B is 10x2, thus ending up with a 10x2 matrix
 
with another comma? :P
A .* B should work
 
It does indeed. Eskerrikasko
 
1:46 PM
@Adriaan wrong language?:D
@AndrasDeak well usually I just test when developing a certain thing, and I rarely hav eto go back and change anything
Thanks for the recommendation of pytest, seems quite a bit more user friendly than the doctest and unittest modules
 
He uses it indistinctively with me an Andras. runs adriaan.thanks(user,language="random")
 
@CrisLuengo Ok I'll get to work then, I think I have found a paper from 1975 that performs slightly worse.
 
No compaints eh :D
 
@AnderBiguri tack tack!
 
Is there a counter of how many beers we owe Andras?
 
1:53 PM
its unlimited
its more than what he can consume in his lifetime
Inf
 
@flawr yup. Testing is indeed meant to be used for development. But you still want it to be streamlined for that case.
 
@AnderBiguri dang that is a lot D:
Imagine the interest!
 
@flawr I made the mistake of using a fixed-size integer so now I owe you 32768 beers
 
hahahaha
 
Haha
wouldn't have happened with haskell, just sain'
 
 
2 hours later…
3:46 PM
@AnderBiguri If you have some time, would you add my accumarray solution to the benchmarging? I just posted it a few minutes ago
 
ugh, I am in another computer now
but feel free to edit it if you want
look at you, all golfy in your answers :P
wrong site ;)
 
Haha. It was two lines initially. But I couldn't resist merging them
The explanation format is very CCGC, yes
 
 
4 hours later…
8:17 PM
my favourite kind of y-axis.
 
8:40 PM
That's old. The weird part is that the real graph looked the same
 
8:53 PM
two months already, time flies
 
9:12 PM
@flawr Hey, at least it's monotonic!
 
Haha
would be fun to have a graph that like went up and down again:)
Like one of those "loading" bars suddenly going backwards.
 
9:26 PM
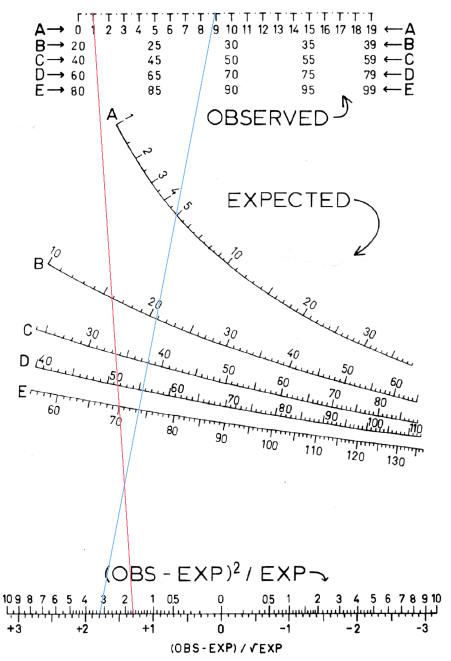
@LuisMendo do you know nomograms? It's a technique for making "charts" for relating numbers (i.e. computing equations) that relies on having (possibly curvy) scales, and usually a straightedge to connect e.g. two different numbers and get a result on a third scale. There are some old fascinating books about it, but it is something that is rarely used anymore.
 
I prefer nonograms
 
^^ chi squared distribution
@AndrasDeak I never actually enjoyed these
 
oh, that's a computational tool, like a slide rule
neat
 
right, and there are some really crazy ones:)
Hm that is actually how addition on elliptic curves works.
d'oh not surprizing considering that this is a cubic :D
or this one:
 
@flawr seems less on the technical side...
 
9:36 PM
right, there are probably simpler means to achieve the same:P
 
hyperbolic geometry is creepy
 
this one is actually the right complex semiplane under the möbius transform f(z) = (z-1)/(z+1), so nothing too hyperbolic:)
things just get squished a bit
 
@flawr Looks like that is useful for computing horoscopes? :)
 
9:53 PM
heh
@flawr any circle with unnecessary other circles inside are is hyperbolic to me
 
@AndrasDeak hyperbolic olympic games would be interesting then:)
@CrisLuengo Not sure if the people who do horoscope stuff understand much about numbers.
 
10:17 PM
@flawr I've seen them sometimes, but never quite got them
@flawr That one is very familiar to me
Smith's chart
The main tool of microwave circuit design :-)
Is that also a nomogram? Then I do understand nomograms \o/
 
Well how do you use smiths chart?
I mean yeah, it is basically a 2d sliderule where one part is just a straightedge.
 
@flawr That's the transform from electrical (normalized) impedance to reflection coefficient of the wave
So in essence you transform from reflection coefficient (the actual point in the complex plane) to impedance (the value read off the curves)
 
So the reflection coefficient determines what signal you get back if you send an "unit wave" into a device with a given impedance?
 
The thing is, certain operations like increasing the length of the transmission line (i.e. cable with radio signals in it) affect the refl coeff in an easy way, but the impedance in a difficult way
@flawr Exactly
Zero reflection (which is often desirable) is the center, i.e. the 0 point
For example, each half wavelength of cable length is an turn in the chart
assuming no losses. Otherwise it's a spiral rather than circles
(the reflected wave loses energy along, so refl coeff approaches the origin)
Good memories for me :-)
 
Hehe:)
 
10:25 PM
I used it a lot when I was a student, and some years ago when I taught a "physical transmission means" lab
 
@LuisMendo was that the one you made the demo video with the little speakers?
 
@flawr No, that was more related to my current Mobile Communucations course
That was also physical propagation, but unguided (i.e. no cable, just propagation through air)
and focused on multipath effects: what happens when the signal can reflect off many obstacles
and how to exploit that for MIMO
 
Ah right I remember, you explained the transmission matrix (or whatever it was called) to me
*channel matrix
 
Ah, yes
It's a great example of putting the singular-value decomposition to good practical use
That's essentially what MIMO aims for: diagonalizing the channel matrix
Are you still teaching? You used to be, right?
 
Currently not, unfortunately, but I'd love to get back to it someday
I always really enjoyed it.
 
10:37 PM
It's rewarding, when you teach something you know well and like
 

« first day (1799 days earlier)      last day (1413 days later) »